Learning all of these multivariate analysis techniques to apply to your data is all well and good, but what happens when you have a data set? What should you do? And in what order? This post gives some suggestions on general strategies for analysing your data and gives a worked example.
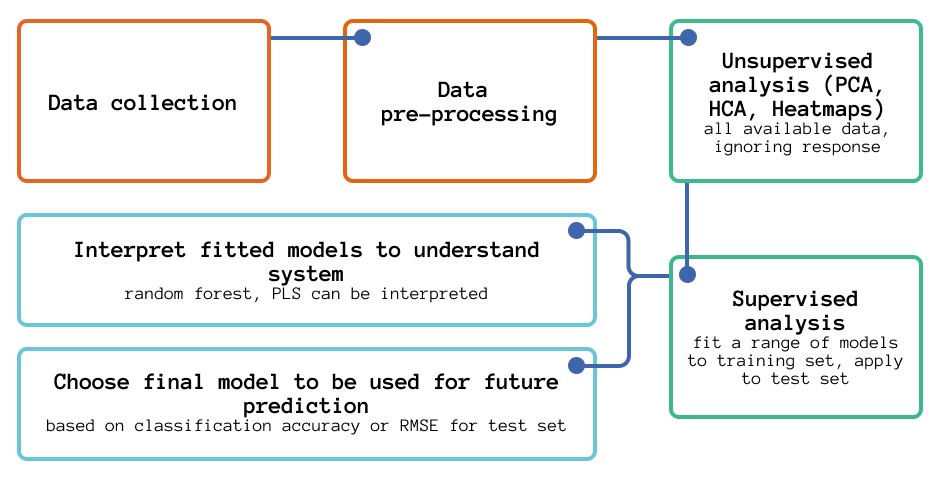
The overall multivariate analysis workflow can involve different aspects of supervised and unsupervised analyses, depending on: (i) data available and (ii) the question(s) being asked.
This workflow example is concerned with when (i) Class memberships is explicitly stated and (ii) identifying patterns and important variables to distinguish class membership response AND building models and algorithms to classify unknowns into a class is the focus.
As discussed in the blog post introducing Multivariate Analysis Workflow, the general workflow can be as follows:
Scenario:
A study into classification of types of glass was motivated by criminological investigation. At the scene of the crime, the glass left can be used as evidence...if it is correctly identified! A researcher analysed glass from builidings and vehicles for a range of parameters, including the refracive index (RI) and composition of a range of elements in the glass.
The researcher analysed 146 glass samples, 70 from building window glass and 76 from vehicle glass. This data was split into a training set (110 samples) and test set (36 samples)
The researchers were interested in seeing if they could: (i) Create models that were capable of differentiating between glass from different sources; (ii) use the models to understand what the underlying differences were between the glasses from different sources.
Analysis:
The data has already been collected, and the next stages involve reading the data into R (Section X) and checking its format (making sure that response and explanatory variables are split).
The next stage is unsupervised analysis/exploratory analysis on the data, looking at the explanatory variables only. Techniques for this include: PCA (Section 3A, Part III), HCA (Section 3A, Part II) and Heatmaps. This stage is particularly concerned with gaining an understanding of the data and identifying any underlying trends and patterns.
Following this, conducting supervised analysis on the data, first fitting models with the training set and then testing with the test set can create models that were capable of differentiating between glass from different sources and use the models to understand what the underlying differences were between the glasses from different sources. For model building, a range of different classification algorithms are possible, including SIMCA, LDA (Section 3B, Part IV), k-nearest neighbours (Section 3B, Part II), PLS-DA and random forest (Section 3B, Part II) and neural networks. Of all of these, PLS-DA and random forest models are the best to interpret.
R Output:
#Reading in the data and checkingglass.training<- read.table(file.choose(),sep=",", header = TRUE)glass.test<-read.table(file.choose(),sep=",", header = TRUE) summary(glass.training)
## Type RI Na Mg
## Length:110 Min. :1.512 Min. :10.73 Min. :0.000
## Class :character 1st Qu.:1.517 1st Qu.:12.85 1st Qu.:3.333
## Mode :character Median :1.518 Median :13.16 Median :3.515
## Mean :1.519 Mean :13.14 Mean :3.158
## 3rd Qu.:1.521 3rd Qu.:13.48 3rd Qu.:3.658
## Max. :1.534 Max. :14.77 Max. :3.980
## Al Si K Ca
## Min. :0.290 Min. :69.81 Min. :0.0000 Min. : 7.880
## 1st Qu.:1.120 1st Qu.:72.18 1st Qu.:0.2550 1st Qu.: 8.395
## Median :1.280 Median :72.72 Median :0.5600 Median : 8.680
## Mean :1.246 Mean :72.55 Mean :0.4595 Mean : 9.210
## 3rd Qu.:1.440 3rd Qu.:72.98 3rd Qu.:0.6075 3rd Qu.: 9.510
## Max. :2.100 Max. :74.45 Max. :0.8100 Max. :16.190
## Ba Fe
## Min. :0.00000 Min. :0.00000
## 1st Qu.:0.00000 1st Qu.:0.00000
## Median :0.00000 Median :0.00000
## Mean :0.04282 Mean :0.07509
## 3rd Qu.:0.00000 3rd Qu.:0.15750
## Max. :3.15000 Max. :0.35000
summary(glass.test)
## Type RI Na Mg
## Length:36 Min. :1.514 Min. :12.61 Min. :3.090
## Class :character 1st Qu.:1.516 1st Qu.:12.88 1st Qu.:3.520
## Mode :character Median :1.516 Median :13.22 Median :3.580
## Mean :1.517 Mean :13.29 Mean :3.596
## 3rd Qu.:1.518 3rd Qu.:13.46 3rd Qu.:3.610
## Max. :1.522 Max. :14.86 Max. :4.490
## Al Si K Ca Ba
## Min. :0.890 Min. :71.36 Min. :0.0600 Min. :7.080 Min. :0
## 1st Qu.:1.265 1st Qu.:72.66 1st Qu.:0.5400 1st Qu.:7.955 1st Qu.:0
## Median :1.415 Median :72.92 Median :0.5900 Median :8.070 Median :0
## Mean :1.429 Mean :72.80 Mean :0.5658 Mean :8.119 Mean :0
## 3rd Qu.:1.540 3rd Qu.:73.11 3rd Qu.:0.6700 3rd Qu.:8.305 3rd Qu.:0
## Max. :2.120 Max. :73.29 Max. :1.1000 Max. :9.150 Max. :0
## Fe
## Min. :0.00000
## 1st Qu.:0.00000
## Median :0.00000
## Mean :0.04972
## 3rd Qu.:0.09250
## Max. :0.32000
#Splitting of response and explanatory variablesexp.glass.training<-glass.training[,-c(1)]res.glass.training<-glass.training[,1]exp.glass.test<-glass.test[,-c(1)]res.glass.test<-glass.test[,1]
#Making sure the response is a factor (qualitative variable) res.glass.training<-as.factor(res.glass.training) res.glass.test<-as.factor(res.glass.test)
###First conducting unsupervised analysis/exploratory analysis on the data, looking at the explanatory variables only
#Combining the explanatory variables into one file AllGlassExplanatory.df <- rbind(exp.glass.training,exp.glass.test) AllGlassExplanatoryMS.df <- scale(AllGlassExplanatory.df, center = TRUE, scale = TRUE)
#HCA glass.euclid<-dist(AllGlassExplanatoryMS.df) glass.HCA<-hclust(glass.euclid) plot(glass.HCA)
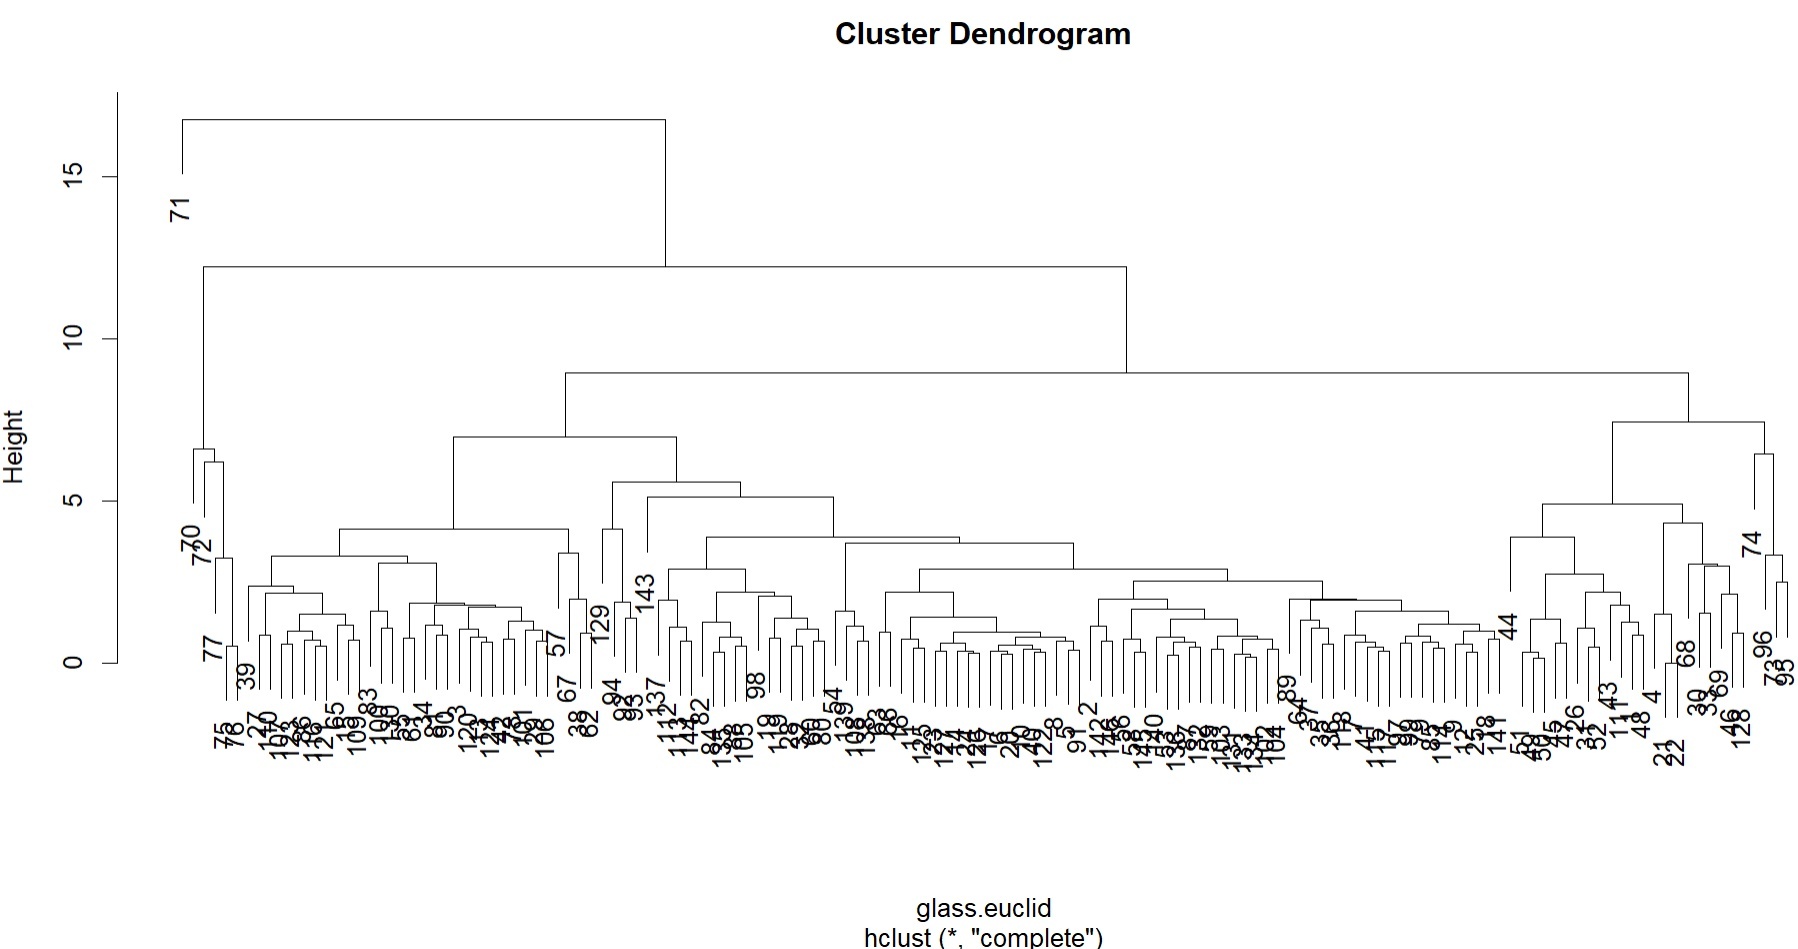
#From the HCA, can see that sample 71 is very different from the others, additionally a smaller subgroup of samples (70, 72, 77, 75, 76) are also clustered distinctly and separately.
#Of all the other samples, there are two large subgroups, which split quite quickly to others.
#Heatmap
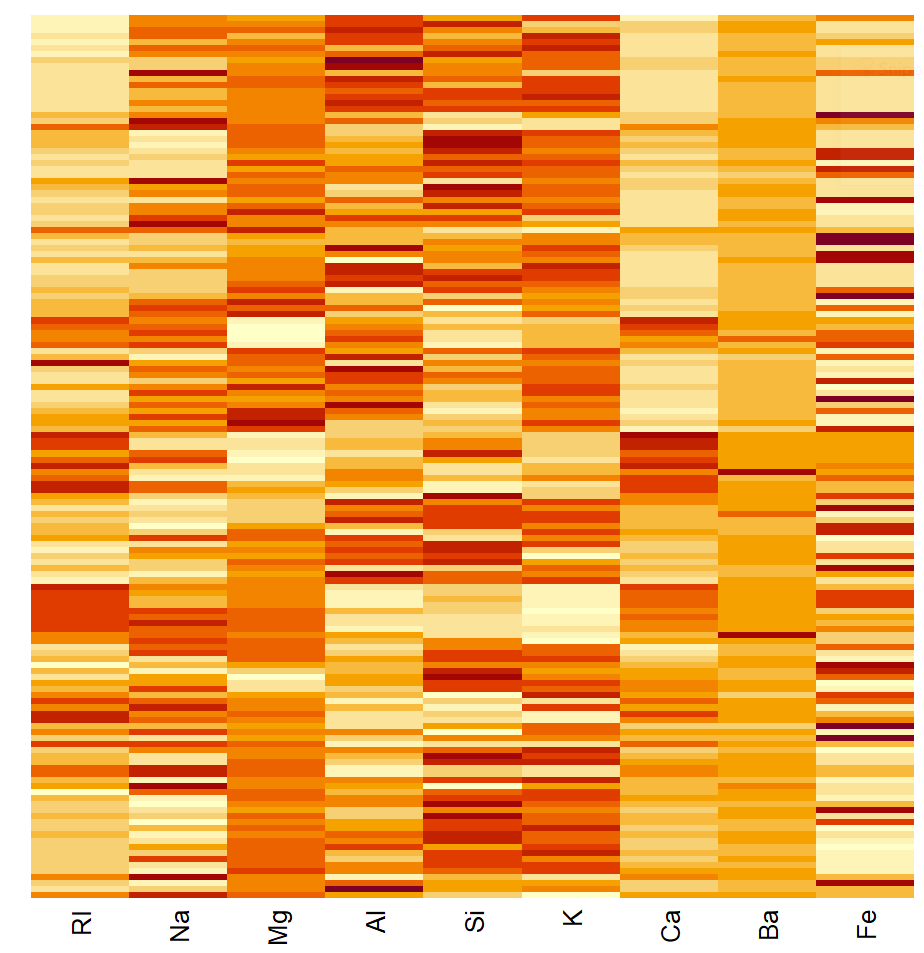
glass.mat<-as.matrix(AllGlassExplanatoryMS.df)heatmap(glass.mat,Colv =NA,Rowv =NA)
heatmap(glass.mat,scale ="column")
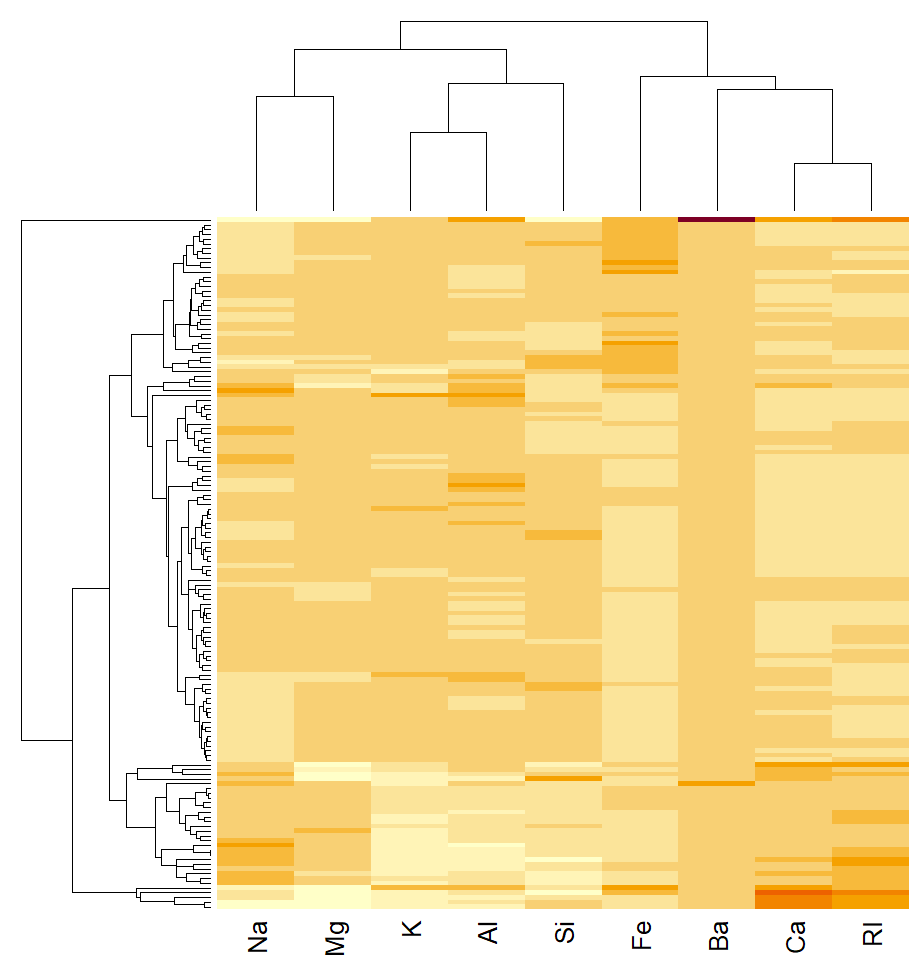
#HCA of the samples the same as HCA. From the heatmap, can see that sample 71has unusually high Ba levels, most likely causing it to be so different to the others.
#clustering of the variables show that RI and Ca are closely aligned and lookto be positively correlated. Na and Mg also positively correlated with eachother, as is K and Al. These seem to be not strongly associatedwith variableslike Ca, RI, Fe.
#PCA
glass.pca<-prcomp(AllGlassExplanatoryMS.df, center = TRUE, scale = TRUE)
print(glass.pca)
## Standard deviations (1, .., p=9):
## [1] 1.90316471 1.43802566 1.08929450 0.94199483 0.77134868 0.61916151 0.45781452
## [8] 0.21555702 0.04160251
##
## Rotation (n x k) = (9 x 9):
## PC1 PC2 PC3 PC4 PC5 PC6
## RI -0.50485785 0.00441147 -0.05256622 0.04090952 0.05129057 -0.32803022
## Na 0.03838445 -0.56175867 -0.35311546 -0.05027879 -0.43600004 0.38750130
## Mg 0.35941395 -0.31399289 -0.26467345 -0.19120352 0.48758791 -0.38704908
## Al 0.26782744 0.41731992 -0.32410933 0.24296547 -0.48317415 -0.02024951
## Si 0.34433464 0.12359693 0.61435705 0.01849107 0.15082897 0.42080880
## K 0.38125577 0.37131152 -0.08791498 0.04489329 -0.12317484 -0.39170681
## Ca -0.49093456 0.14110165 0.21893490 0.05492916 -0.15721255 -0.13021887
## Ba -0.18226140 0.37953583 -0.50594127 0.18156291 0.51046252 0.48101521
## Fe -0.06765353 0.30749750 -0.09151330 -0.92836837 -0.11342325 0.11478252
## PC7 PC8 PC9
## RI 0.017115293 -0.79168676 -0.05802490
## Na 0.301361061 -0.20986120 0.28393985
## Mg -0.250910759 -0.07031861 0.45844234
## Al -0.545612341 -0.18086484 0.16050314
## Si -0.006382748 -0.44545312 0.30013714
## K 0.722291025 -0.07088903 0.10812723
## Ca 0.028951620 0.29167880 0.74868981
## Ba 0.155145167 -0.01129839 0.13283969
## Fe -0.039827873 -0.05362499 0.01113644
summary(glass.pca)
## Importance of components:
## PC1 PC2 PC3 PC4 PC5 PC6 PC7
## Standard deviation 1.9032 1.4380 1.0893 0.94199 0.77135 0.6192 0.45781
## Proportion of Variance 0.4024 0.2298 0.1318 0.09859 0.06611 0.0426 0.02329
## Cumulative Proportion 0.4024 0.6322 0.7641 0.86265 0.92876 0.9714 0.99464
## PC8 PC9
## Standard deviation 0.21556 0.04160
## Proportion of Variance 0.00516 0.00019
## Cumulative Proportion 0.99981 1.00000
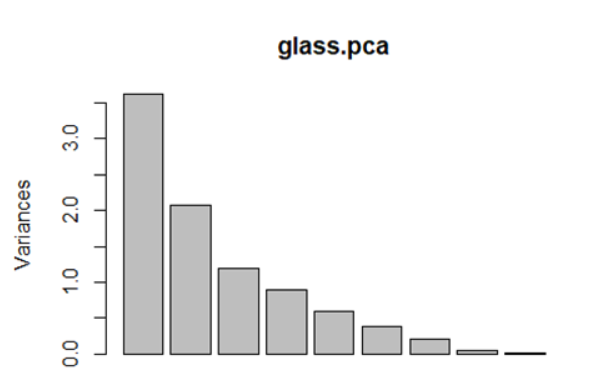
screeplot(glass.pca)
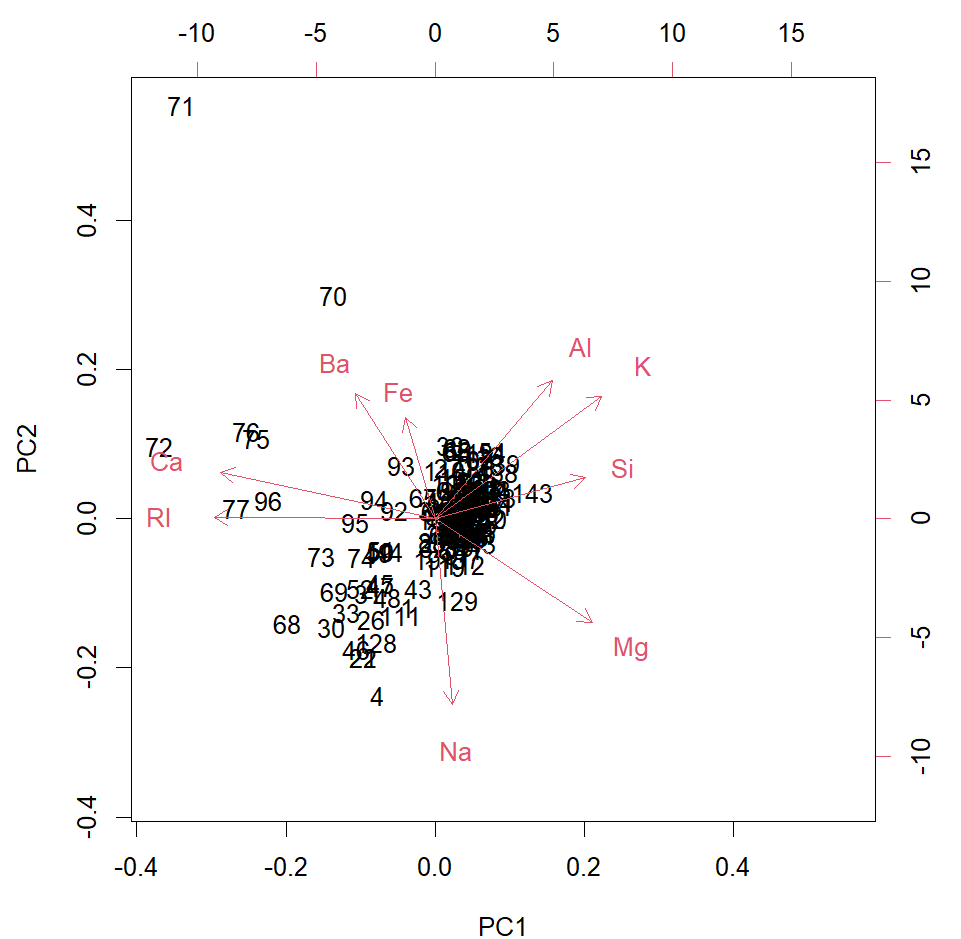
biplot(glass.pca)
#screeplot and cumulative variance show that, first two PCs only account for 63% of variation. Would suggest to look at more PCs to understand the variability in the data (up to PC5 looks to be appropriate)
#Biplot of PC1 and PC2 in line with the HCA - 71 very far from others - an outlier (is the Ba measurement wrong?)?. The other cluster of 70, 72, 76, 75 and 96 are all a bit different to the rest too. Of the others, two sub-clusters, one tightly packed and the other less, so, but grouped.
# Ca and RI strongly positively correlated, as seen in heatmap also. Al, K and Si are also, as is Ba and Fe. Si seems to be negatively correlated with RI and Ca. The "outlying samples" are higher in Ba, Ca and RI compared to the majority of samples.
###Next conducting supervised analysis/exploratory analysis on the data, first fitting models with the training set and then testing with the test set
#Splitting the explanatory variables back into training and test sets TrainingGlassExplanatoryMS.df <- AllGlassExplanatoryMS.df[c(1:110),] TestGlassExplanatoryMS.df <- AllGlassExplanatoryMS.df[-c(1:110),]
#SIMCA require("mdatools")
## Loading required package: mdatools
## Warning: package 'mdatools' was built under R version 4.2.3
building.exp<-TrainingGlassExplanatoryMS.df[c(1:70),] vehicle.exp<-TrainingGlassExplanatoryMS.df[-c(1:70),] building.se = simca(building.exp, classname = "Building") vehicle.se = simca(vehicle.exp, classname = "Vehicle") glass.simca<- simcam(models = list(building.se, vehicle.se), info = 'Glass SIMCA') summary(glass.simca)
##
## SIMCA multiple classes classification (class simcam)
##
## Number of classes: 2
## Info: Glass SIMCA
##
## Summary for calibration results
## Ncomp TP FP TN FN Spec. Sens. Accuracy
## Building 8 66 30 10 4 0.250 0.943 0.691
## Vehicle 8 38 33 37 2 0.529 0.950 0.682
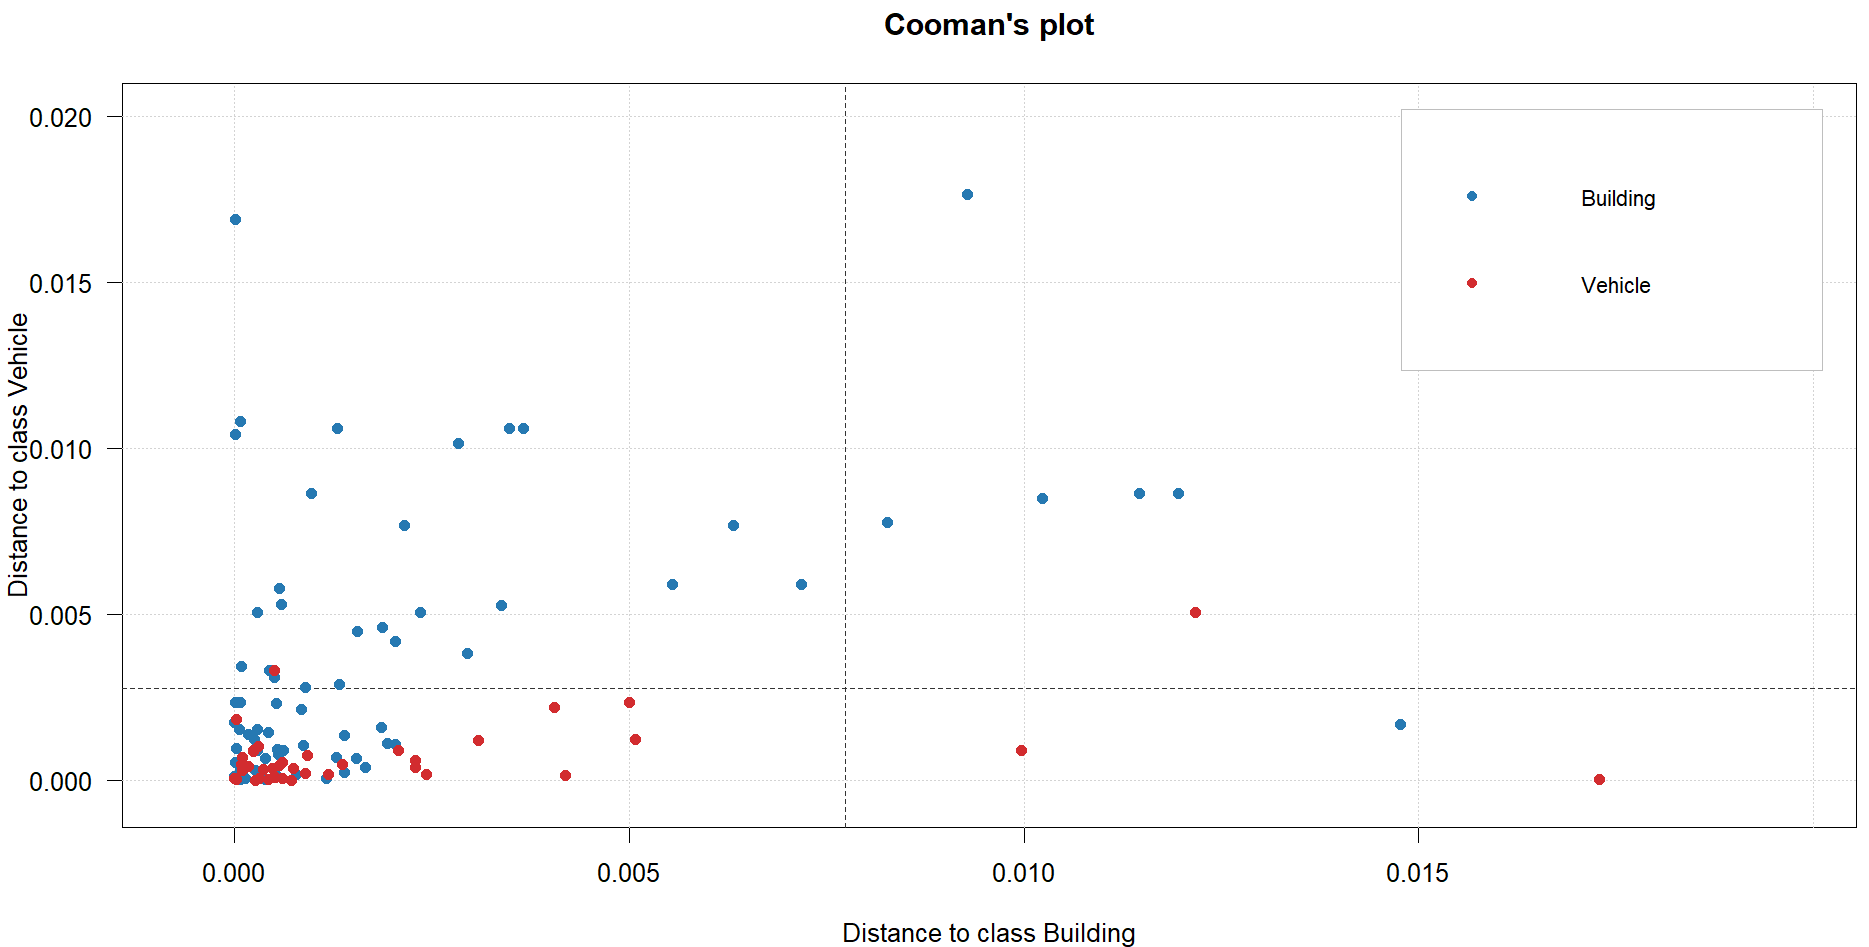
plotCooman(glass.simca)
glass.simaca.pred <- predict(glass.simca, TestGlassExplanatoryMS.df, res.glass.test) summary(glass.simaca.pred)
##
## Summary for SIMCA multiple classes classification result
##
## Number of classes: 2
## Ncomp TP FP TN FN Spec. Sens. Accuracy
## Building 8 17 15 3 1 0.167 0.944 0.556
## Vehicle 8 13 13 5 5 0.278 0.722 0.500
plotPredictions(glass.simaca.pred)
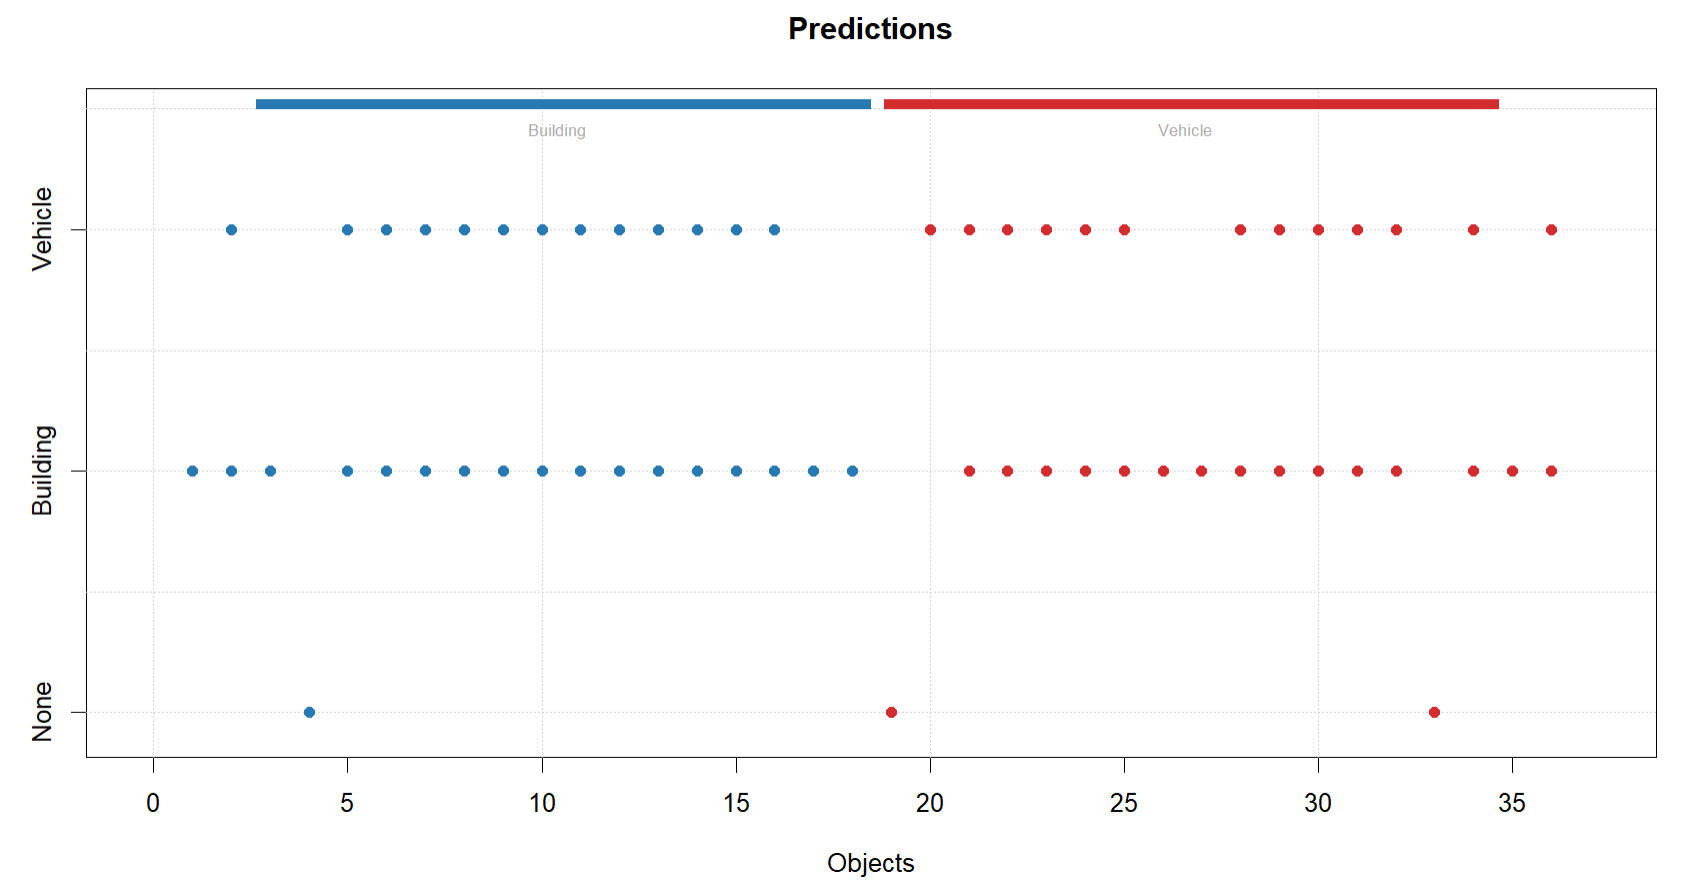
#SIMCA model not that great - as a soft classifier, it is assigning most samples in the test set to BOTH classes, so not separating them well. Classification accuracy for Building is 56% and vehicle is 50%. Model not very good for classification and wouldnt advise its use.
#LDA require("MASS")
## Loading required package: MASS
Glass.lda <- lda(x = TrainingGlassExplanatoryMS.df,grouping = res.glass.training) print(Glass.lda)
## Call:
## lda(TrainingGlassExplanatoryMS.df, grouping = res.glass.training)
##
## Prior probabilities of groups:
## Building Vehicle
## 0.4727273 0.5272727
##
## Group means:
## RI Na Mg Al Si K
## Building 0.1240132 0.1413660 0.2707820 -0.5289065 -0.10441628 -0.29543661
## Vehicle 0.2328912 -0.2511281 -0.4627118 0.2069303 -0.08513247 0.03550838
## Ca Ba Fe
## Building 0.01623526 -0.05659596 -0.1186052
## Vehicle 0.33890108 0.12556882 0.2263905
##
## Coefficients of linear discriminants:
## LD1
## RI 1.134734
## Na -3.758572
## Mg -6.869009
## Al -1.243812
## Si -4.024910
## K -1.579375
## Ca -10.393782
## Ba -2.103177
## Fe 0.122006
plot(Glass.lda)
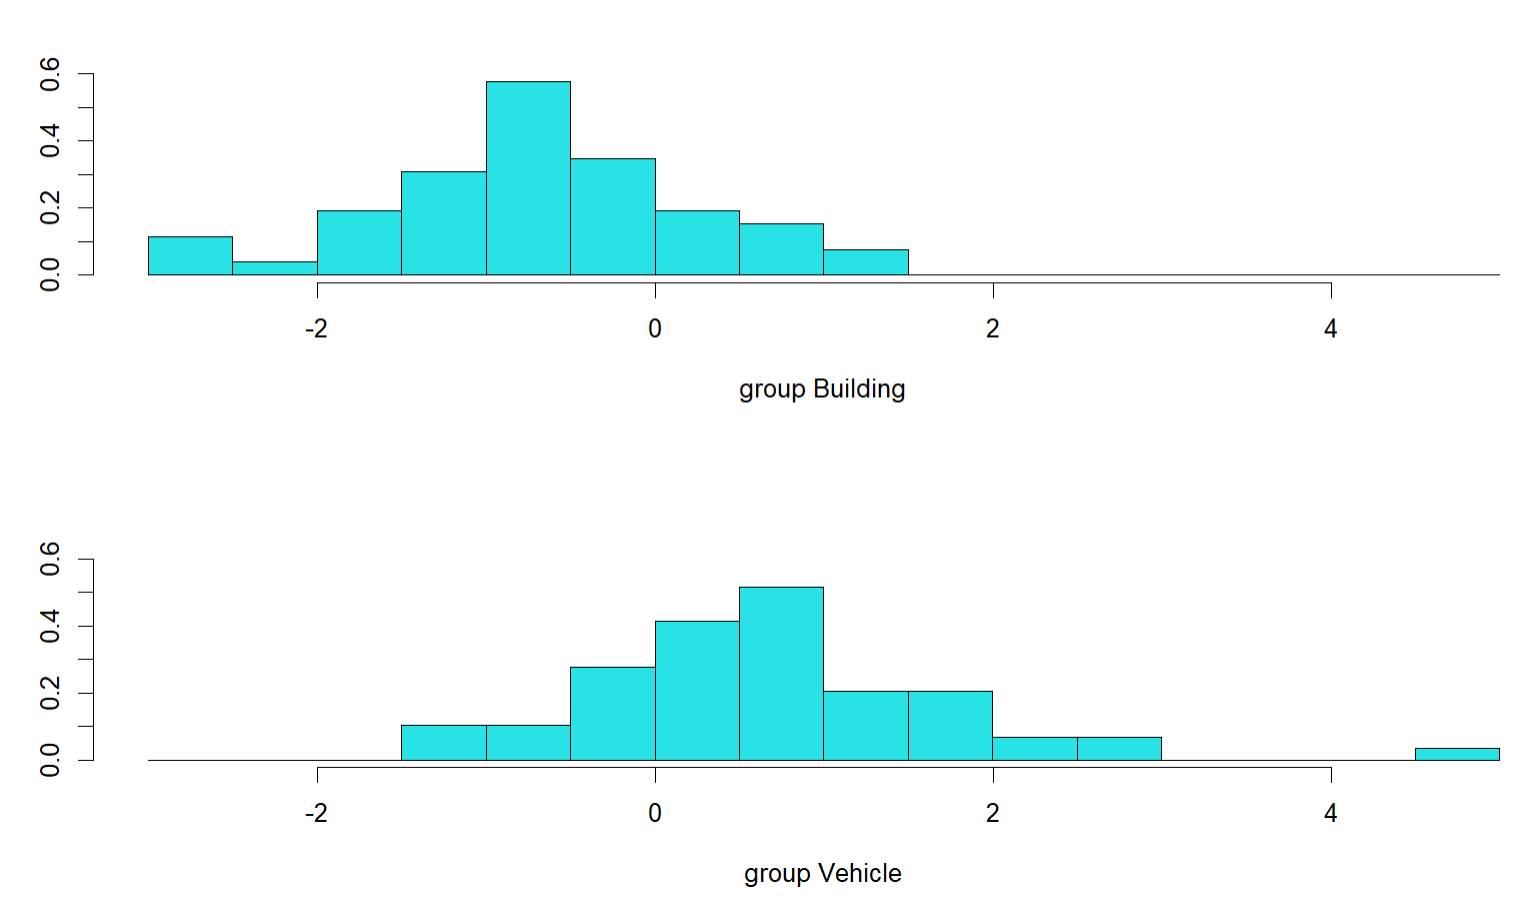
#Orthogonal distributions do have different means, but are highly overlapping. Indicates okay but not excellent separation of classes, so expect the model to not be brilliant.
Glass.Lda.pred <- predict(Glass.lda, newdata = TestGlassExplanatoryMS.df) print(table(res.glass.test, Glass.Lda.pred[["class"]]))
##
## res.glass.test Building Vehicle
## Building 13 5
## Vehicle 5 13
#classification accuracy = 72%
#kNN require("class")
## Loading required package: class
glass.knn.pred<-knn(train = TrainingGlassExplanatoryMS.df, test = TestGlassExplanatoryMS.df, cl = res.glass.training, k = 5) table(res.glass.test,glass.knn.pred)
## glass.knn.pred
## res.glass.test Building Vehicle
## Building 13 5
## Vehicle 2 16
#classification accuracy = 81%
#PLS-DA require(mdatools) glass.PLS.1<-plsda(TrainingGlassExplanatoryMS.df,res.glass.training, ncomp = 9, scale = FALSE, cv = 1 ) summary(glass.PLS.1)
##
## PLS-DA model (class plsda) summary
## ------------------------------------
## Info:
## Number of selected components: 4
## Cross-validation: full (leave one out)
##
## Class #1 (Building)
## X cumexpvar Y cumexpvar TP FP TN FN Spec. Sens. Accuracy
## Cal 83.25 26.23 34 15 43 18 0.741 0.654 0.700
## Cv NA NA 32 17 41 20 0.707 0.615 0.664
##
## Class #2 (Vehicle)
## X cumexpvar Y cumexpvar TP FP TN FN Spec. Sens. Accuracy
## Cal 83.25 26.23 43 18 34 15 0.654 0.741 0.700
## Cv NA NA 41 20 32 17 0.615 0.707 0.664
getConfusionMatrix(glass.PLS.1$calres)
## Building Vehicle None
## Building 34 18 0
## Vehicle 15 43 0
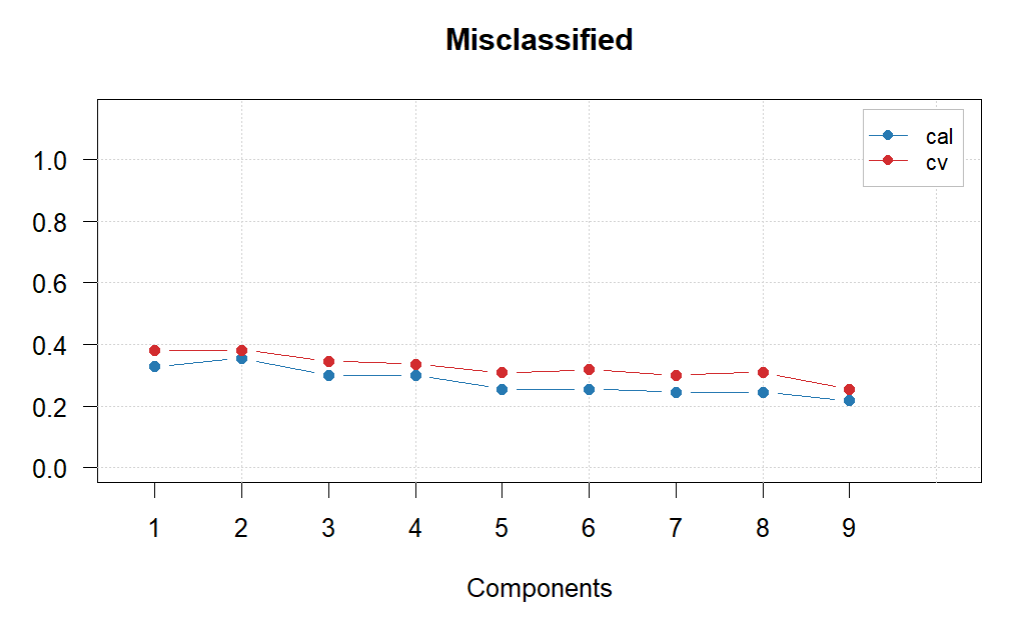
plotMisclassified(glass.PLS.1)
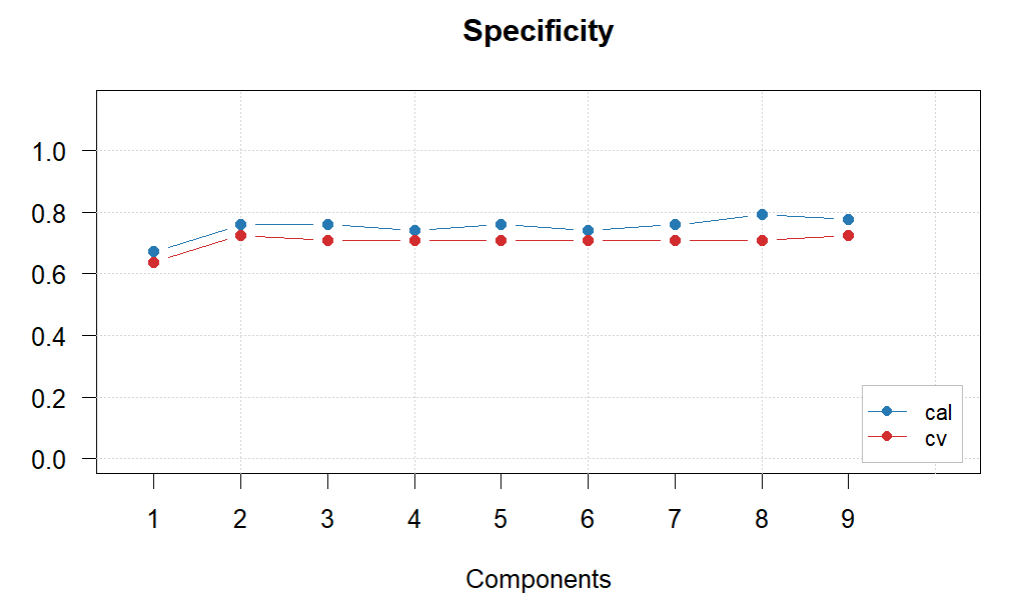
plotSpecificity(glass.PLS.1)
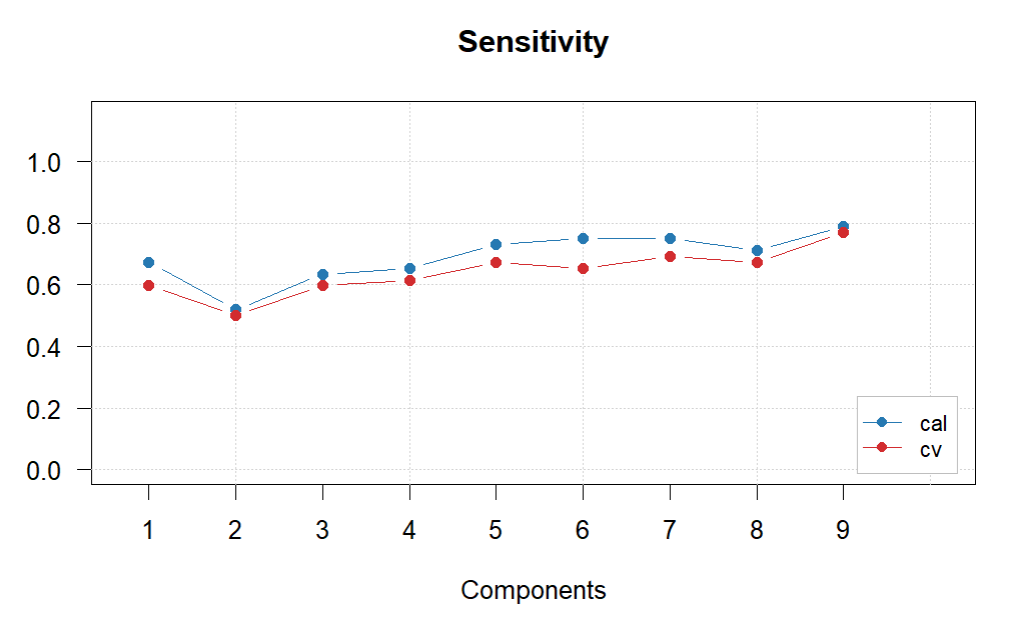
plotSensitivity(glass.PLS.1)
glass.PLS.1$cvres$misclassified
## [,1] [,2] [,3] [,4] [,5] [,6] [,7]
## Building 0.3818182 0.3818182 0.3454545 0.3363636 0.3090909 0.3181818 0.3
## Vehicle 0.3818182 0.3818182 0.3454545 0.3363636 0.3090909 0.3181818 0.3
## Total 0.3818182 0.3818182 0.3454545 0.3363636 0.3090909 0.3181818 0.3
## [,8] [,9]
## Building 0.3090909 0.2545455
## Vehicle 0.3090909 0.2545455
## Total 0.3090909 0.2545455
#Difficult to choose final number of PCs. The lowest missclassification is with 9 by quite a margin, so have decided to go with this, also has the best sensitivity.
glass.PLS.final<-plsda(TrainingGlassExplanatoryMS.df,res.glass.training, ncomp = 9, scale = FALSE, cv = 1 )glass.pls.res<- predict(glass.PLS.final, TestGlassExplanatoryMS.df, res.glass.test)
plotPredictions(glass.pls.res)
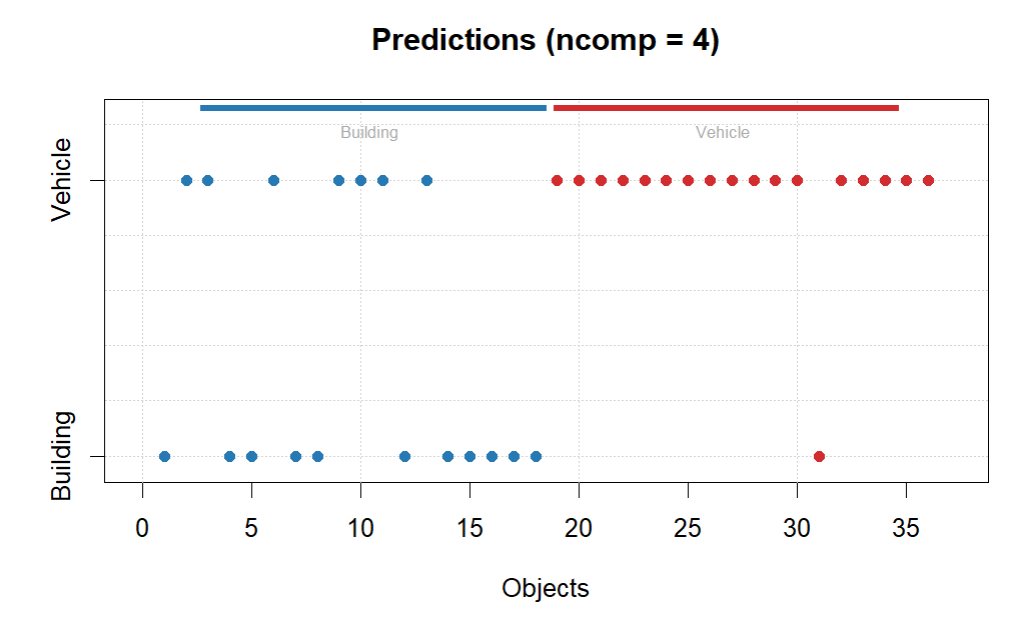
getConfusionMatrix(glass.pls.res)
## Building Vehicle None
## Building 11 7 0
## Vehicle 1 17 0
#classification accuracy = 78%
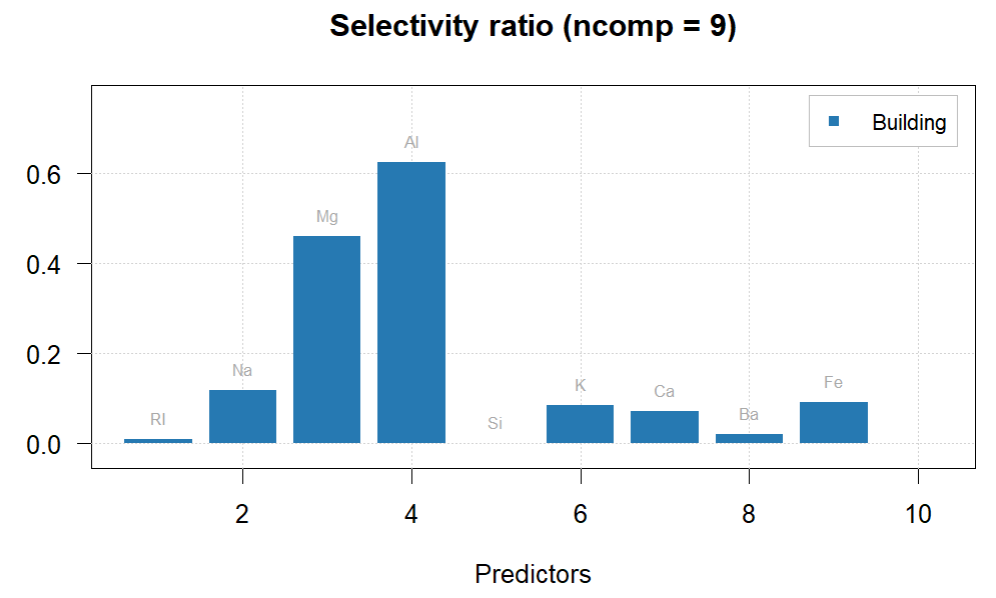
plotSelectivityRatio(glass.PLS.final, ncomp = 9, type = "h", show.labels = TRUE)
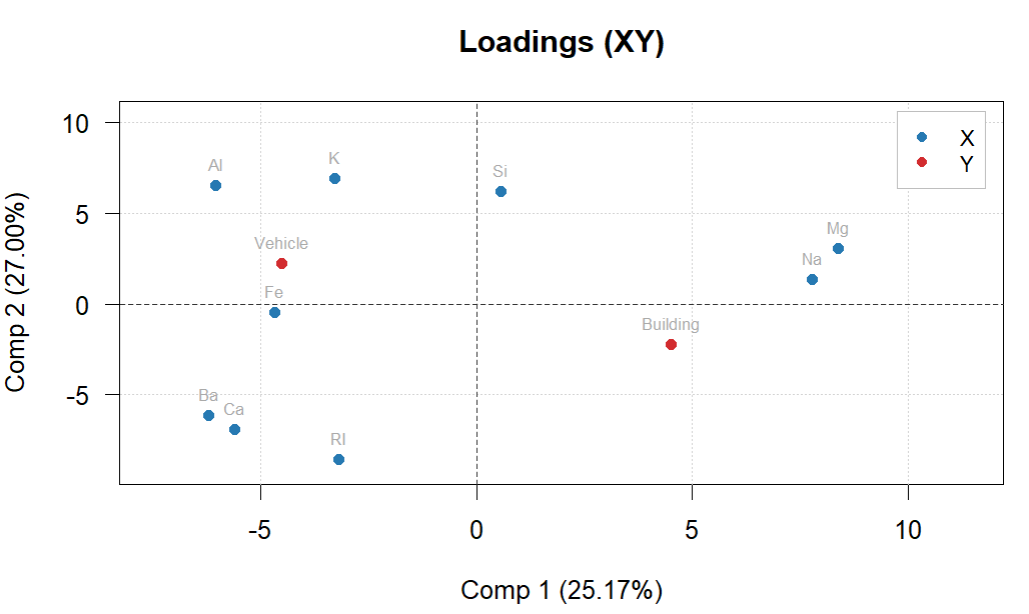
plotXYLoadings(glass.PLS.final, show.labels = TRUE)
#Al and Mg have the highest selectivity between classes according to the selectivity ratio.
#Loadings plot indicates that Al generally higher in the vehicle glass while Mg is higher in building glass
#RandomForest require("randomForest")
## Loading required package: randomForest
## Warning: package 'randomForest' was built under R version 4.2.3
## randomForest 4.7-1.1
## Type rfNews() to see new features/changes/bug fixes.
glass.rf<-randomForest(x = exp.glass.training, y = as.factor(res.glass.training)) print(glass.rf)
##
## Call:
## randomForest(x = exp.glass.training, y = as.factor(res.glass.training))
## Type of random forest: classification
## Number of trees: 500
## No. of variables tried at each split: 3
##
## OOB estimate of error rate: 15.45%
## Confusion matrix:
## Building Vehicle class.error
## Building 44 8 0.1538462
## Vehicle 9 49 0.1551724
glass.rf.res<-predict(glass.rf, newdata = exp.glass.test, type = "class") print(table(res.glass.test, glass.rf.res))
## glass.rf.res
## res.glass.test Building Vehicle
## Building 12 6
## Vehicle 0 18
#classification accuracy = 81% (for one, but this could change each time)
varImpPlot(glass.rf)
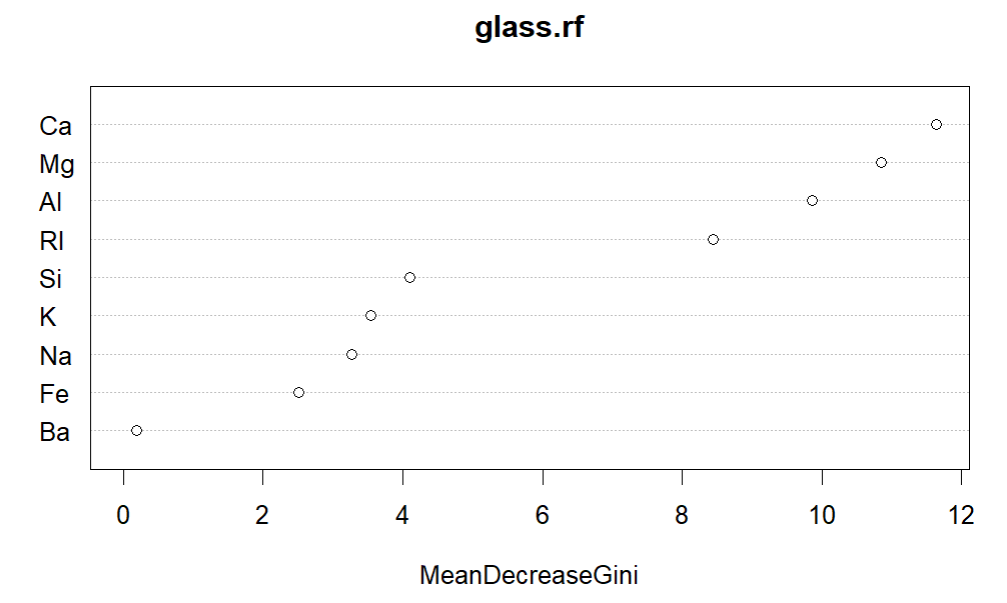
#Ca, Mg and Al most important for random forest model
#Neural Network require("neuralnet")
## Loading required package: neuralnet
## Warning: package 'neuralnet' was built under R version 4.2.3
glass.nn<-neuralnet(Type~.,data = glass.training, hidden = c(6,2), linear.output = FALSE)
glass.nn.pred<-predict(glass.nn, exp.glass.test)prediction_label <- data.frame(max.col(glass.nn.pred))prediction <- cut(prediction_label$max.col.glass.nn.pred, 2, labels=c('Building', 'Vehicle'))print(table(res.glass.test, prediction))
## prediction
## res.glass.test Building Vehicle
## Building 10 8
## Vehicle 0 18
#classification accuracy = 78%
#All the models have about ~78-81% accuracy, except for SIMCA - see comments above, don't advise to use, and LDA which performed not as well, again see comments about above about orthogonal distribution as reason why.
#overall, would be fine to work with neural network, PLS-DA, random forest or kNN, moving forward, although would ideally like to have better performance. Perhaps need to try to build up sample size to have a bigger training set?
#Ca, Mg and Al seem to be the most important for classification and differ most notably between building and vehicle glass.
Based on the results, a summary of the investigation can be presented and future directions can be outlined:
Model creation: all the models had about ~78-81% accuracy, except for SIMCA - see comments above (and thus SIMCA is not advised to use), and LDA which did not perform (see comments about above about orthogonal distribution as reason why). Overall, it would be good to work with neural network, PLS-DA, random forest or kNN, moving forward, although would ideally like to have better performance.
Interpreting the models: it was apparent that Ca, Mg and Al seem to be the most important for classification and differ most notably between building and vehicle glass.
This is one example of a complete workflow for analysis of a complex multivariate data set – use this as a template for your own analysis!
